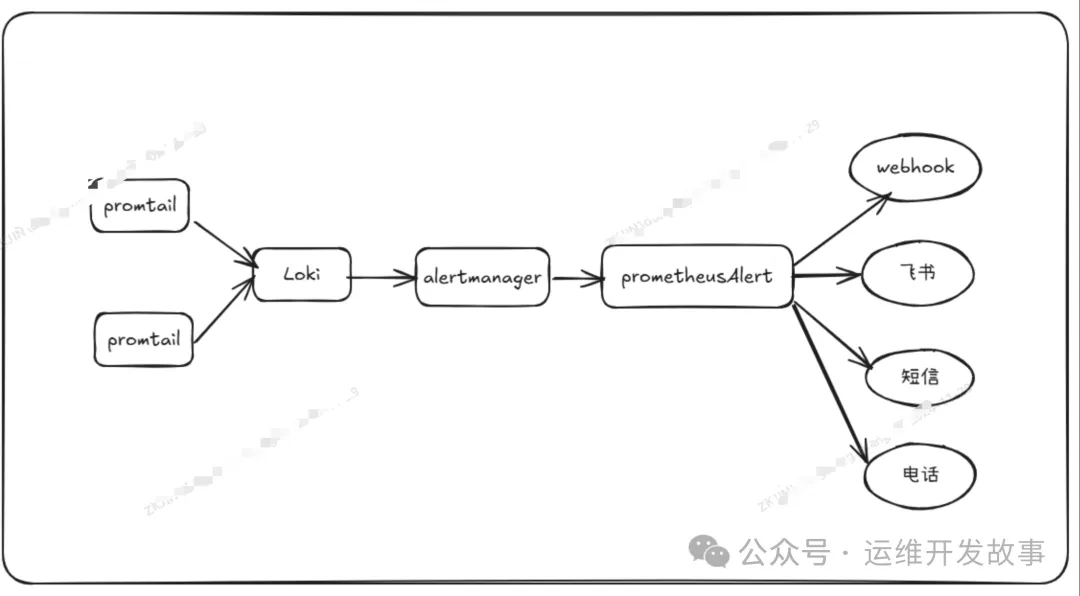
1.配置ingress service,暴露metrics端口
kubectl get svc -n ingress-controller
NAME                               TYPE        CLUSTER-IP       EXTERNAL-IP   PORT(S)                      AGE
ingress-nginx-controller           NodePort    10.244.100.195   <none>        80:30080/TCP,443:30443/TCP   562d
默认情况下ingress-nginx的监控指标端口为10254,监控路径为其下的/metrics。调整配置ingress-nginx的配置文件,打开service及pod的10254端口。
新建service.yaml
apiVersion: v1
kind: Service
metadata:
  name: ingress-nginx-controller-metrics
  namespace: ingress-controller
  labels:
    #k8s-app: ingress-nginx #注意,与pod的labels保持一致
    app.kubernetes.io/component: controller
    app.kubernetes.io/instance: ingress-nginx
    app.kubernetes.io/name: ingress-nginx
  annotations:
    prometheus.io/port: "10254"
    prometheus.io/scrape: "true"
spec:
  type: ClusterIP
  ports:
  - name: metrics
    port: 9913
    protocol: TCP
  selector:
    #k8s-app: ingress-nginx #注意,与pod的labels保持一致
    app.kubernetes.io/component: controller
    app.kubernetes.io/instance: ingress-nginx
    app.kubernetes.io/name: ingress-nginx
创建该资源
kubectl apply -f service.yaml
再次查看service
kubectl get svc -n ingress-controller
NAME                               TYPE        CLUSTER-IP       EXTERNAL-IP   PORT(S)                      AGE
ingress-nginx-controller           NodePort    10.244.100.195   <none>        80:30080/TCP,443:30443/TCP   562d
ingress-nginx-controller-metrics   ClusterIP   10.244.66.153    <none>        9913/TCP                     562d
2.配置servicemonitors抓取
servicemonitor.yaml
apiVersion: monitoring.coreos.com/v1
kind: ServiceMonitor
metadata:
  name: ingress-nginx-controller-metrics
  labels:
    k8s-app: ingress-nginx
  namespace: monitoring
spec:
  endpoints:
  - interval: 30s
    port: metrics
  jobLabel: k8s-app
  namespaceSelector:
    matchNames:
    - ingress-controller
  selector:
    matchLabels:
      #k8s-app: ingress-nginx #注意labels与上面的service保持一致
      app.kubernetes.io/component: controller
      app.kubernetes.io/instance: ingress-nginx
      app.kubernetes.io/name: ingress-nginx
创建该资源
kubectl apply -f servicemonitor.yaml
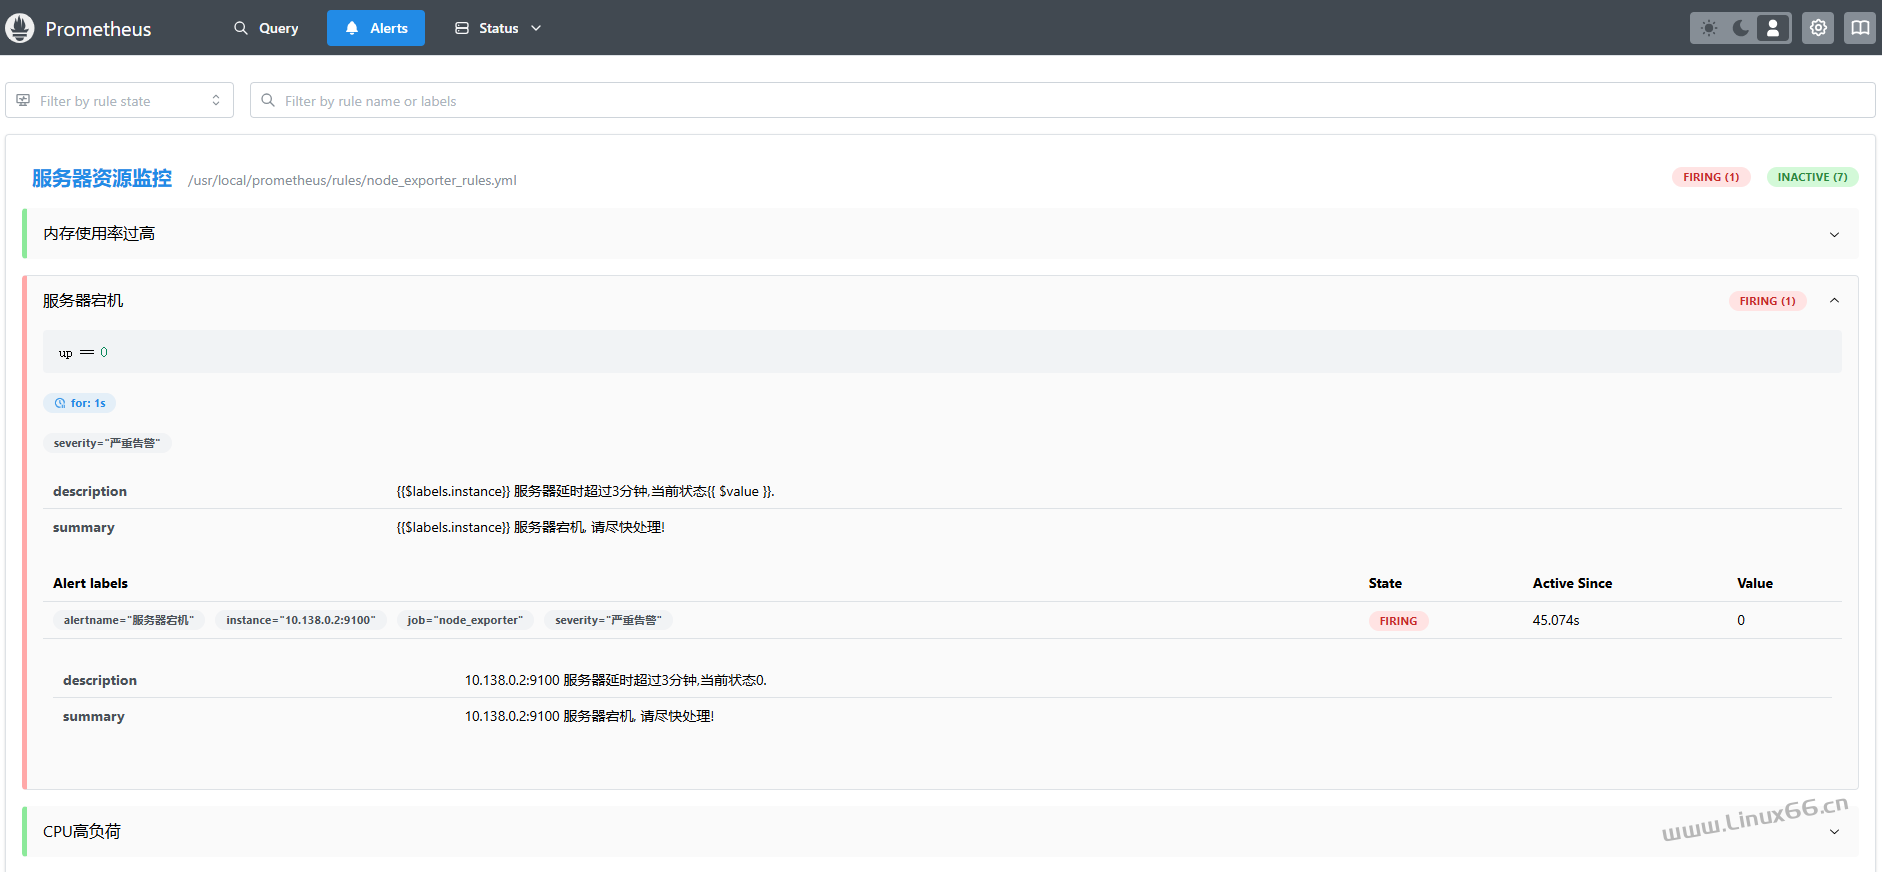
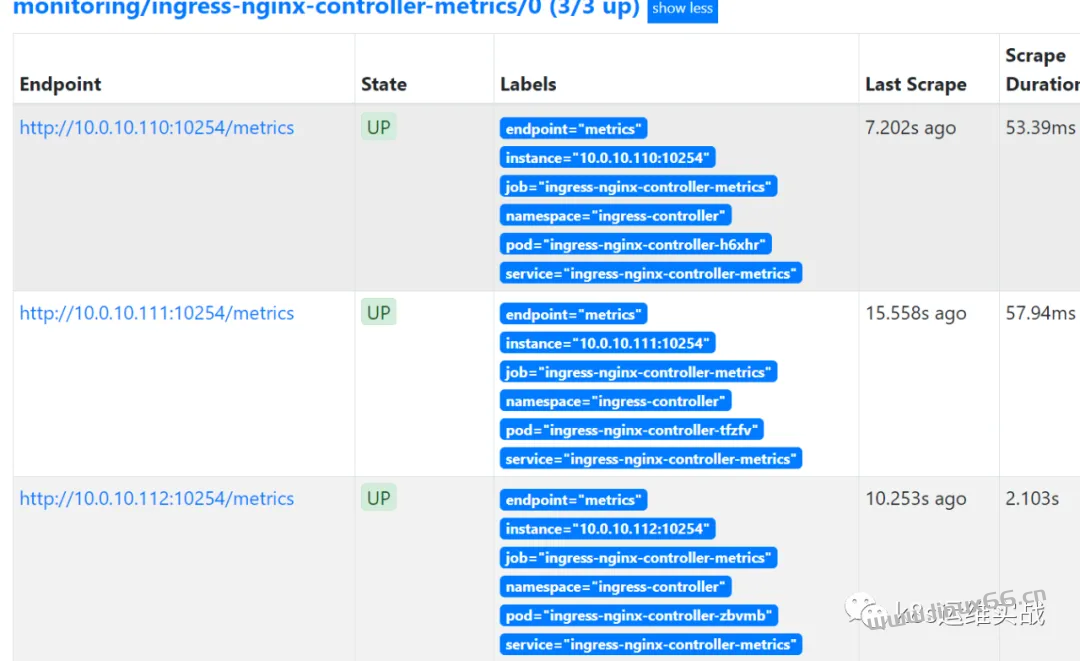
3.在kube-prometheus中查看ingress-nginx Target
4.导入Grafana模板
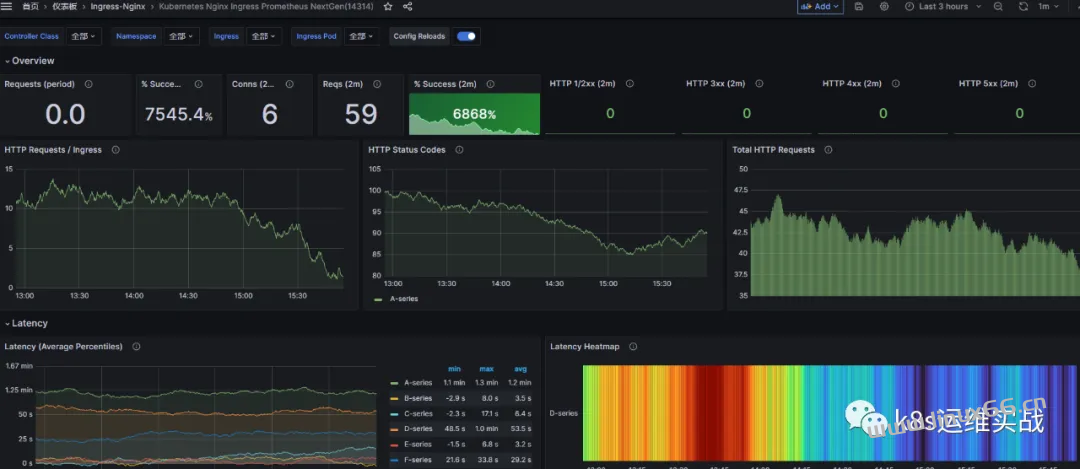
Ingress-nginx模板ID:9614
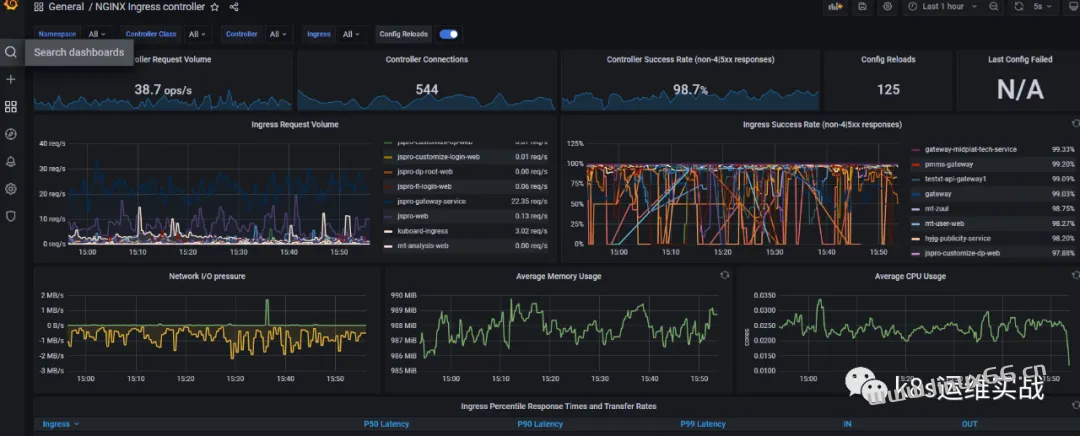
Ingress-nginx模板ID:14314
5.配置告警规则
rules.yaml
apiVersion: monitoring.coreos.com/v1
kind: PrometheusRule
metadata:
  labels:
    prometheus: k8s
    role: alert-rules
  name: nginx-ingress-rules
  namespace: monitoring
spec:
  groups:
  - name: nginx-ingress-rules
    rules:
    - alert: NginxFailedtoLoadConfiguration
      expr: nginx_ingress_controller_config_last_reload_successful == 0
      for: 1m
      labels:
        severity: critical
      annotations:
        summary: "Nginx Ingress Controller配置文件加载失败"
        description: "Nginx Ingress Controller的配置文件加载失败,请检查配置文件是否正确。"
    - alert: NginxHighHttp4xxErrorRate
      expr: rate(nginx_ingress_controller_requests{status=~"^404"}[5m]) * 100 > 1
      for: 1m
      labels:
        severity: warining
      annotations:
        description: Nginx high HTTP 4xx error rate ( namespaces {{ $labels.exported_namespace }} host {{ $labels.host }} )
        summary: "Too many HTTP requests with status 404 (> 1%)"
    - alert: NginxHighHttp5xxErrorRate
      expr: rate(nginx_ingress_controller_requests{status=~"^5.."}[5m]) * 100 > 1
      for: 1m
      labels:
        severity: warining
      annotations:
        description: Nginx high HTTP 5xx error rate ( namespaces {{ $labels.exported_namespace }} host {{ $labels.host }} )
        summary: "Too many HTTP requests with status 5xx (> 1%)"
    - alert: NginxLatencyHigh
      expr: histogram_quantile(0.99, sum(rate(nginx_ingress_controller_request_duration_seconds_bucket[2m])) by (host, node)) > 3
      for: 2m
      labels:
        severity: warining
      annotations:
       description: Nginx latency high ( namespaces {{ $labels.exported_namespace }} host {{ $labels.host }} )
       summary: "Nginx p99 latency is higher than 3 seconds"
    - alert: NginxHighRequestRate
      expr: rate(nginx_ingress_controller_nginx_process_requests_total[5m]) * 100 > 1000
      for: 1m
      labels:
        severity: warning
      annotations:
        description: Nginx ingress controller high request rate ( instance {{ $labels.instance }} namespaces {{ $labels.namespaces }} pod {{$labels.pod}})
        summary: "Nginx ingress controller high request rate (> 1000 requests per second)"
    - alert: SSLCertificateExpiration15day
      expr: nginx_ingress_controller_ssl_expire_time_seconds < 1296000
      for: 30m
      labels:
        severity: warning
      annotations:
        summary: SSL/TLS certificate for {{ $labels.host $labels.secret_name }} is about to expire
        description: The SSL/TLS certificate for {{ $labels.host $labels.secret_name }} will expire in less than 15 days.
    - alert: SSLCertificateExpiration7day
      expr: nginx_ingress_controller_ssl_expire_time_seconds < 604800
      for: 30m
      labels:
        severity: critical
      annotations:
        summary: SSL/TLS certificate for {{ $labels.host $labels.secret_name }} is about to expire
        description: The SSL/TLS certificate for {{ $labels.host $labels.secret_name }} will expire in less than 7 days.